Evaluate Machine Learning Performance

On this page
Evaluating Machine Learning performance is essential for selecting right model, tuning parameters, detecting overfitting/underfitting, and assesing the model generalization ability to new data (unseen data in training process). To evalute the performance we can use performance metrics that provide a quantitative basis. The choice of the performance metrics are depends on the type of problem we are trying to solve (regression, classification, clustering, etc.).
Performance Metrics
These are common machine learning performance metrics base on the problem:
1. Regression
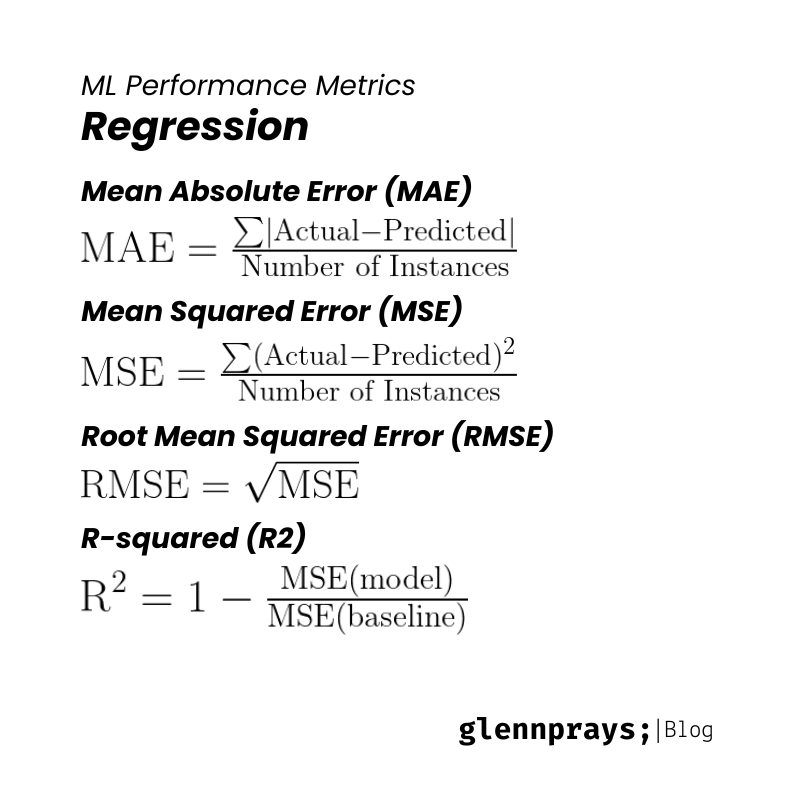
- Mean Absolute Error (MAE)
Average of the absolute difference between the actual and predicted values. It can used when metrics is not sensitife to outliers, simply it tolerate the outliers data. - Mean Squared Error (MSE)
Measure the average of the squared difference between the actual and predicted values. Use this metrics when outliers is important to be detected. - Root Mean Squared Error (RMSE)
This is the modified version of MSE because it squared of MSE. By squaring the MSE, it makes interpretable measure of the metric on the same scale as the target variable, so it can be more understandable. - R-squared (R2)
It measure how well the predicted value match the actual value by using range from 0 to 1. The higher the value, the better the model. It can be negative if the model is worse than the baseline model. It can be used to compare the model performance with the baseline model. Use this model when we want to understand variance explained by the model relative to the baseline model.
2. Classification
Before discussing about classification metrics, we have to know about confusion matrix. Confusion matrix is a table that describe the performance of a classification model. Confusion matrix particularly relevant in binary classification but can be extended for multi-class classification. There are four terms in confusion matrix:
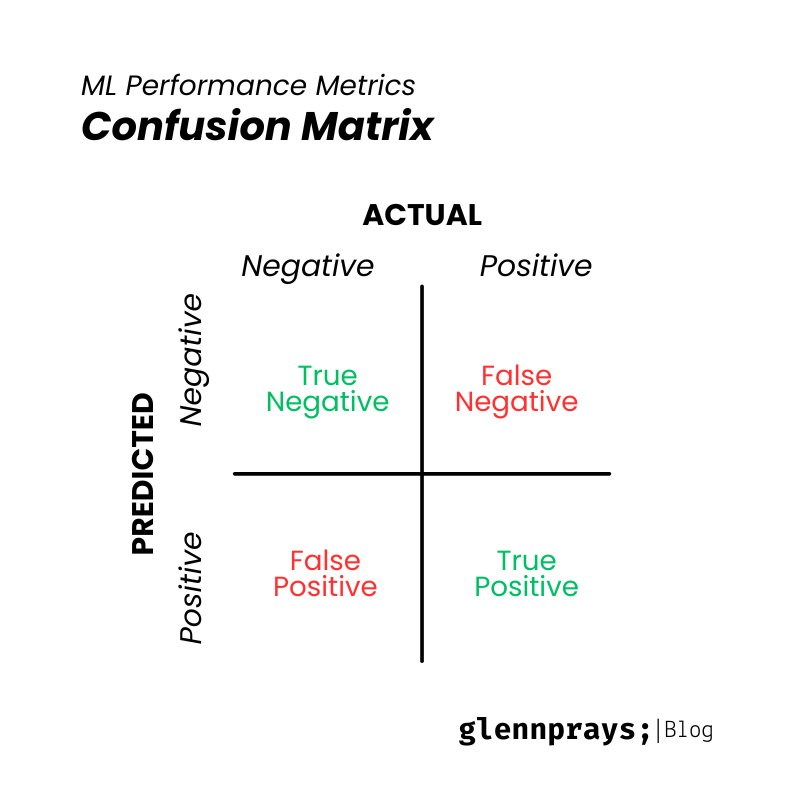
- True Positive (TP): Instance correcly predicted as positive.
- False Positive (FP): Instance correcly predicted as positive but actually negative.
- True Negative (TN): Instance correcly predicted as negative.
- False Negative (FN): Instance correcly predicted as negative but actually positive.
From those terms, we can calculate the performance metrics:
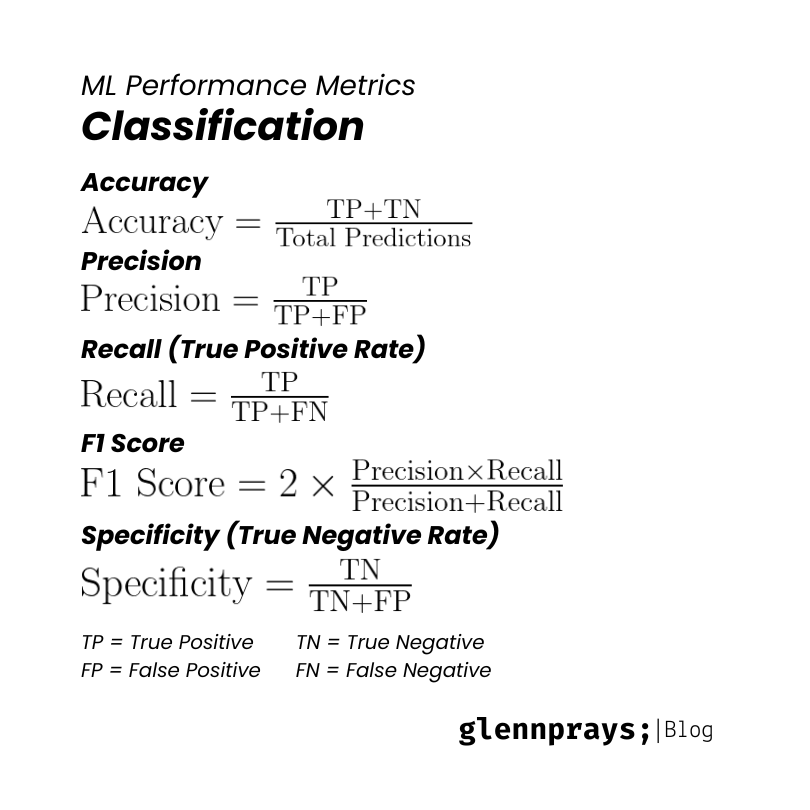
- Accuracy
It measure the percentage of correct predictions. Use this metrics when the data is balanced, it means that each class has as similar number of instances. - Precision
Measure the accuracy of positive prediction, that indicating how many positive instances are actually positive. It used when false positive is more important and reduce falsely predicted as positive. - Recall (True Positive Rate)
Ability to measure all relevant positive instance. Use this metrics when false negative is more important and reduce falsely predicted as negative. - F1 Score
It provide balance between precision and recall that consider both false positive and false negative. It used when there is an uneven class distribution. - Specificity (True Negative Rate)
The ratio of true negative prediction to the total actual negative instances. Use this metrice when false positive is more important and reduce falsely predicted as positive.
3. Clustering
- Silhouette Coefficient
It measure how similar an object is to its own cluster (cohetion), it measure how well-defined the cluster, compared to other clusters (separation), measure how well instances are separate from other cluster. It used when we want evaluate quality of the clusters. - Davies-Bouldin Index
Measure the compactness and separation betwen clusters. Lower values indicate a better clustering.
Conclusion
The choice between each performance metrics should align with the spesific objectives and constraints of the problem. The chosen metrics reflect the true impact of the model's performance on the end-users